

While the Red Sox have, for the most part, scored more runs of late—averaging 5.3 over their past 10 games—they’re still, at 376 total runs scored, just above the 30-club MLB average (367).
At this rate, Boston will finish with 677 runs scored in 2015. That’s above the 634 scored by the abysmal 2014 crew, but otherwise the lowest run tally since 552 in strike-shortened season of 1994, when they finished 4th in the division. For fewer runs in a full 162-game schedule you need to go back to 1992 (599). Only 26 times in the past 95 years have the Sox scored fewer than their projected 677 runs in a season.
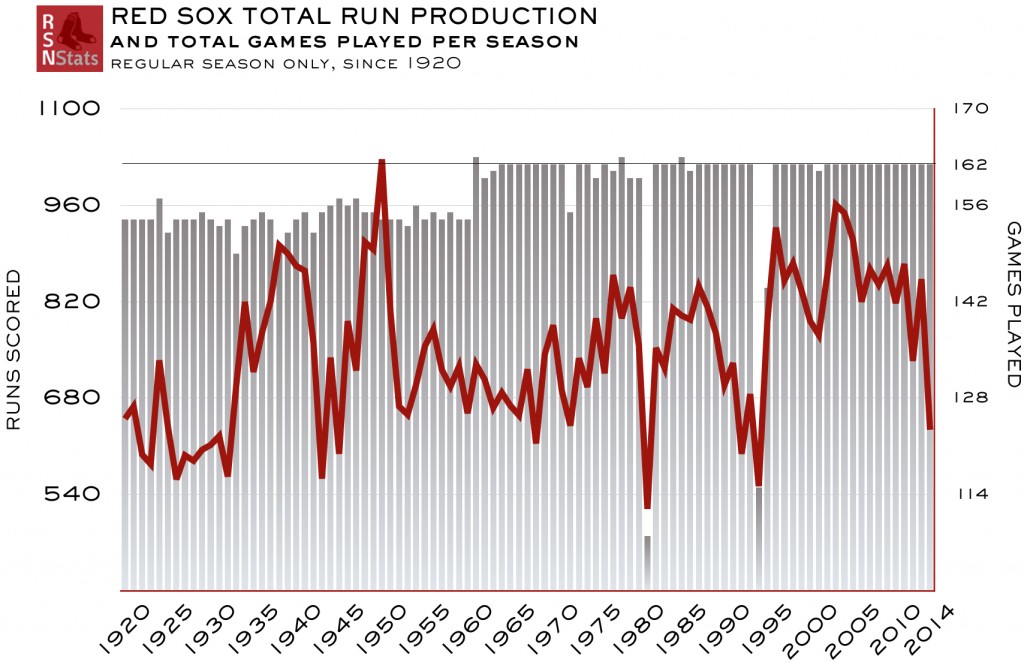

Fans who’ve paid attention (or renewed attention) to the Sox since the 2004 World Series championship can be excused for finding the lack of production surprising. Excluding this year and last, the Red Sox have averaged 854.3 regular-season runs per year since 2004, including 949 regular-season runs in the run up to the 2004 championship. Since 1914, the 2004 tally was Boston’s 3rd-most runs scored behind only the 1950 and 2003 clubs, which collected 1,027 and 961 runs, respectively.
The 1950 results were, in fact, the only time the Sox amassed more than 1,000 runs in any season of club history. That year, the Red Sox averaged a franchise-best 6.67 runs/game, one of only two seasons since 1914 where the club averaged 6 or more runs per game. The other was 6.01 in 1938.
If the 2015 season ended today the Red Sox average would be 4.18 runs per game, among the 20 lowest such averages for any Boston season since 1920.