

The goal of @RSNStats on Twitter was to be a worthy accompaniment to enjoy alongside Red Sox games. As the game unfolds, the @RSNStats Twitter feed often comes alive with statistics and other tidbits that, hopefully, enhance your enjoyment of the game.
@RSNStats followers are a diverse group. Some are diehard fans with encyclopedic knowledge of the game and Red Sox history. Others are new to baseball or to Red Sox Nation. Everyone’s welcome, and the ever-evolving @RSNStats data feed tries to keep things entertaining to fans across the spectrum.
The average stat
A very common statistic you’ll see in the @RSNStats data feed is batting average (abbreviated as AVG), which may be provided in total or within a given context. For example, you might see a player’s AVG for the whole season or for the particular situation they’re in right now (such as with the bases loaded).
AVG is a basic, very straightforward statistic. It’s simply the number of hits divided by the number of at-bats expressed to three decimal places. 19 hits over 73 at-bats, for example, yields a .260 AVG.
But as common as AVG is, many fans realize its limitations, too. For one thing, AVG ignores the value of walks, a critically important offensive tool. AVG also treats all hits equally, so hitting a home run or a double counts the same as hitting a single.
To address deficiencies in AVG many fans turn to two other baseball statistics: On-Base Percentage (OBP) and Slugging Percentage (SLG).
Understanding On-Base Percentage
OBP helps you better understand how often a batter avoids making an out.
Rather than just divide the number of hits by number of at-bats, as you do with AVG, OBP is calculated by dividing the number of hits a batter gets plus the number of times he walks plus the number of times he gets hit by a pitch with his total at-bats, hits, walks, hits-by-pitch, and sacrifice flies.
“If you tell me I can only know one thing about a hitter,” Keith Law writes in his excellent 2017 book Smart Baseball, “I want to know how often he gets on base—that is, how often he doesn’t make an out. [OBP] is a simple number that encapsulates a couple core skills, from the ability to make contact to plate discipline and pitch recognition, and has more predictive value going forward than batting average does.”

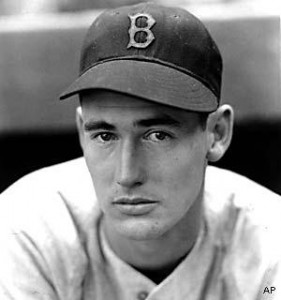
Ted Williams
Most people learn early on that any AVG over .300, meaning the batter gets a hit at least 30% of the time, is pretty good. In 2016, across all of baseball, batters got 42,276 hits over 165,561 at-bats for an MLB AVG of .255 (the Red Sox team AVG in 2016 was an MLB-best .282 compared to .277 in the club’s 2013 World Championship season).
So what’s a good OBP? Well, across all of baseball OBP for 2018 was .318.
Among Red Sox with at least 250 at-bats, the all-time best single-season OBP was .553 by Ted Williams in 1941. For his career, Williams’ OBP was a club-best .482. Since 1990 Manny Ramirez owns the best single-season OBP of .450 in 2002.
A hit is not a hit
Not all hits are created equal. After all, which would you rather have? A player who, in his last 10 at-bats, hit 3 singles or one that hit a single, a double, and a home run? At 3-for-10, both players have a .300 AVG, but while the slugging percentage for the singles hitter is .300, the SLG for the other player is .700.
SLG addresses the problem that all hits are not equal by counting doubles as being twice as valuable as base hits, and valuing triples and home runs at 3× and 4× the value of a single, respectively.
For the player with a single, double, and a home run in his last 10 at-bats the SLG calculation is ((1×1) + (1×2) + (0×3) + (1×4)) / 10.
A perfect SLG would be 4.000, which could be achieved by hitting nothing but home runs. Across all of baseball, SLG for 2016 was .417.
Among Red Sox with at least 250 at-bats, the all-time best single-season SLG was .735 by Ted Williams in 1941. For his career, Williams slugged a club-best .634. Since 1990 Manny Ramirez owns the best single-season SLG of .647 in 2002 (though Mookie Betts came within a whisper of that with a .640 SLG in 2018).
Putting it all together
No one statistic explains the whole picture which is why AVG, OBP, and SLG are often presented together, and in that specific order, in what’s called a slash line that lists all three: .252 AVG/.314 OBP/.394 SLG or just .252/.314/.394, for short.
Since 2015 @RSNStats followers have increasingly requested slash lines to enhance their enjoyment of the game and so you’ll often see slash lines in the data feed.
Your thoughts on slash lines, and any other statistics you’d like to see more of, are welcome here. Just leave your comments below.
Learning more
Over the past few years weighted on-base average (or wOBA, for short), a sabermetric based on linear weights that was created by Tom Tango, has become a more accepted view of a player’s overall offensive strength. Starting in 2018 wOBA started showing up more regularly in the @RSNStats data feed. You can learn more about wOBA right here on the RSNStats web site.
Baseball is all about the numbers and we’re just scratching the surface. For a lot more coverage about baseball stats I like A Mathematician at the Ballpark: Odds and Probabilities for Baseball Fans
