


The Sox open Wednesday with 20 wins, tied for the second most in the American League and tied for the third most in baseball after the Cubs (25) and White Sox (23).
Red Sox offense, particularly explosive over the past two games, has been good for an average 5.6 runs per game, second only to the Cubs (6.2), while Sox pitching is improving with average runs allowed per game down to 4.4, just ahead of the 4.4 average for all Major League teams. Starters’ ERA is 4.62, sixth highest in the AL, though Boston relievers’ ERA is down to 3.57, seventh best in the junior circuit. Red Sox pitchers have struck out 299 batters, the most in the AL and just four fewer than the Phillies to lead MLB.
The Sox lead the AL in runs scored (183), triples (10), RBI (174) and total bases (548). Though Boston batters have just 104 walks, one below the average for all MLB clubs, team OBP, SLG, and OPS are an AL-best .349, .470, and .820, respectively.
What’s more, Boston tops all of baseball for team AVG (.288), runs scored (336), and doubles (81).
On the field, Red Sox defense has been superb with a .991 fielding percentage, just a hair below the .992 mark set by baseball’s leading team, the Nationals.
For some time we’ve expected this lineup to hit for power. Now, in 11 straight games, Red Sox batters have collected at least one home run per game, quickly amassing 37 on the season, good for 6th best in the AL. The 11 games with at least one HR is the longest such streak for the Sox since a 12-in-a-row streak July 26-August 6, 2011.
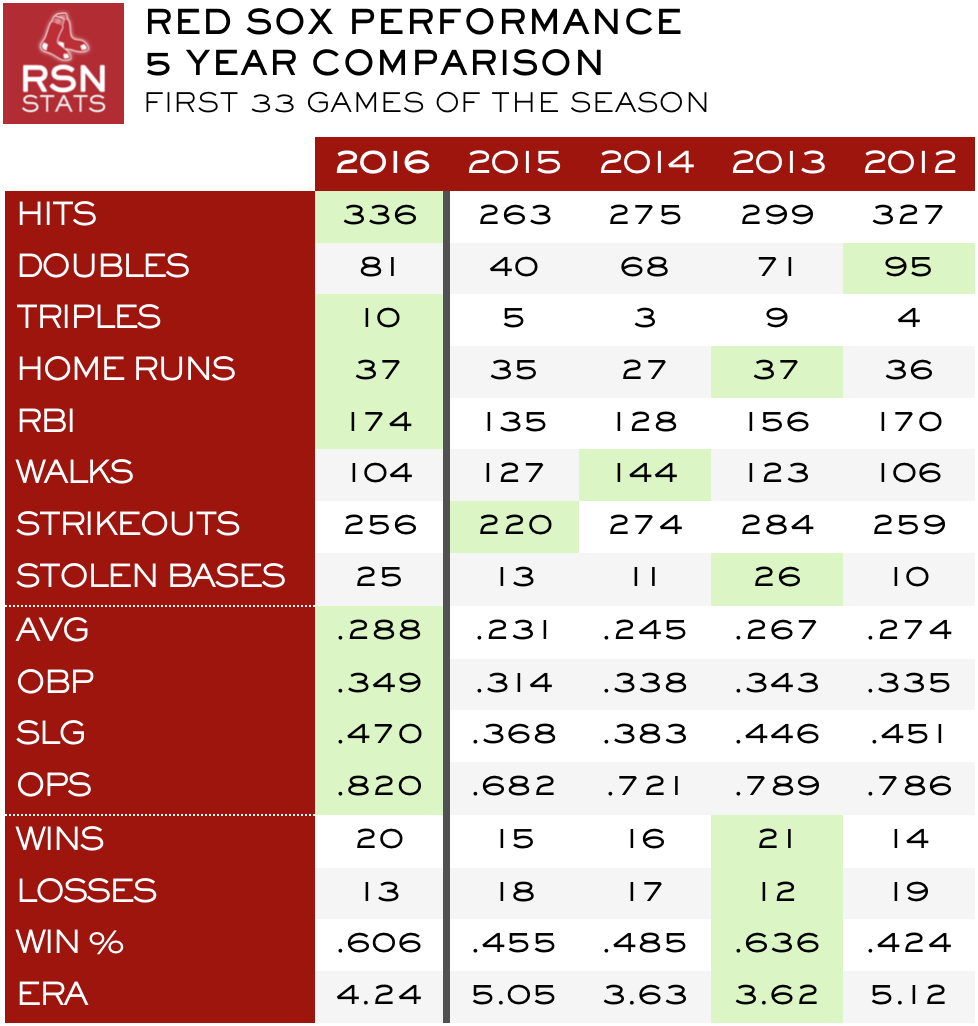
Keeping up this torrid pace would be wonderful, if not unlikely. Still, as the table here shows, given the sample size we have, the 2016 team compares favorable with Sox teams over the past five years this far into the season.