

Over at @RSNStats on Twitter there is increasing reliance on two valuable stats for measuring offensive production and pitching strength. They’re OPS+ and ERA+ and their names may lead you to undervalue what they can tell you. After all, most stats-minded baseball fans know that OPS and ERA have their limitations. Still, the plus versions of these stats offer improvements that make these stats useful for reasonably comparing how a player or team is performing.
There are several plus stats used in modern baseball and they share one important trait: they normalize what they tell you relative to average league performance.
What this means is that any plus stat at 100 represents average performance. A plus stat at 110 represents performance that’s 10% better than league average, while one at 90 means performance that’s 10% worse than the average.
In addition to normalization, the plus stats also take park factors, such as dimensions and altitude, into consideration. Adjustments for performance in hitter or pitcher friendly ballparks help make it easier to compare today’s players but can also be applied to players of the past, making comparisons across eras more reasonable.
OPS+ and ERA+ Leaders
For all-time, the top single-season OPS+ among qualified batters was 281 by Josh Gibson of the 1943 Homestead Grays. Since 1970, the best OPS+ is 268 by Barry Bonds in 2002.
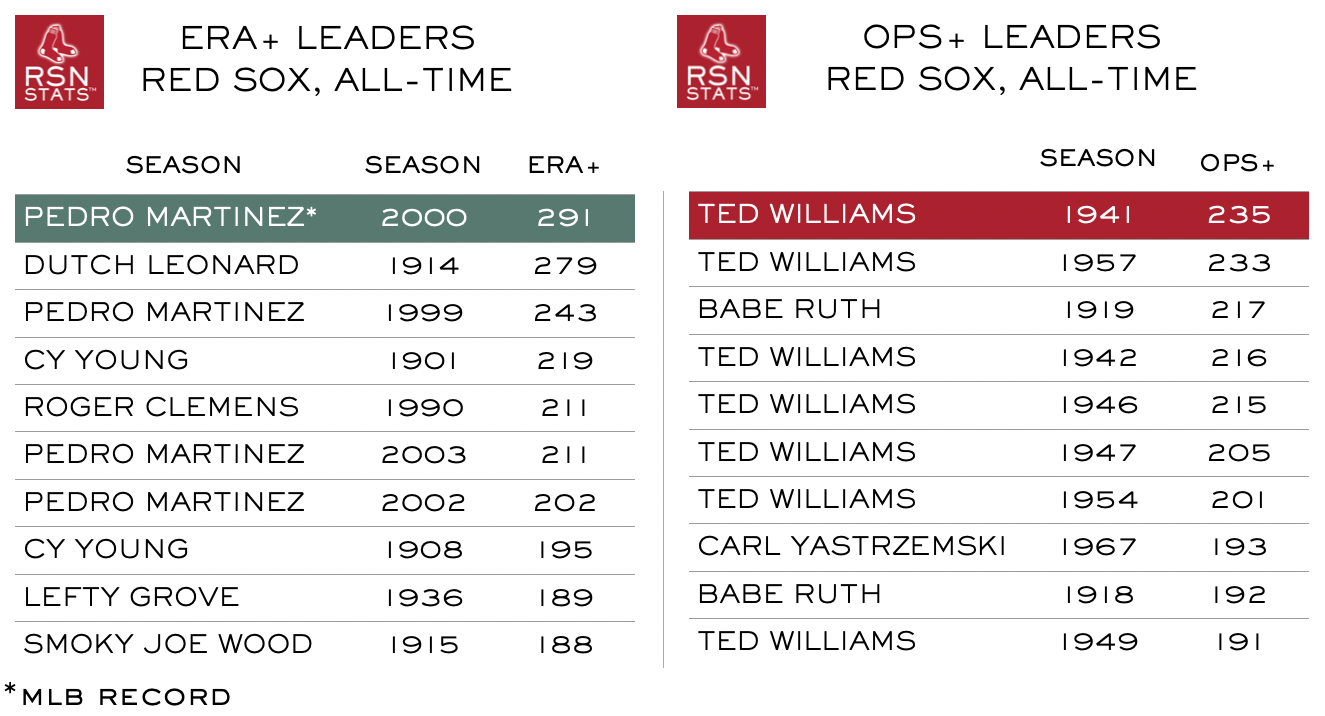
Ted Williams sits atop the Red Sox all-time leaderboard with a 235 OPS+ in 1941. Williams, in fact, dominates the Boston leaderboard, holding seven of the Top 10 spots.
With a 527 ERA+, the all-time single-season pitching leader is Robert Keyes of the 1944 Memphis Red Sox. Since 1970, the best ERA+ for any season in the Major Leagues was 291 by Pedro Martinez for the 2000 Red Sox. Four seasons for Martinez are in Boston’s Top 10 all-time ERA+ leaderboard.
50 Years of World Champions
In the 50 seasons from 1971 to 2021 no team that won a World Series had a regular-season OPS+ of less than 90. Similarly, there wasn’t a championship team in that span with an ERA+ under 96.
In fact, 64% of World Series winners in that time had an OPS+ of 100 or better. More starkly, 88% of those winning teams had an ERA+ of at least 100.
The lowest OPS+ for a World Champion was 90 for the 1988 Dodgers. The highest was 123 for the 2017 Astros. The lowest ERA+ for a champion was 96 for the 2012 Giants; the highest was 146 for the 2020 Dodgers.
Red Sox in the Fall Classic
For the Red Sox, OPS+ in their most recent World Championship seasons was 107 in 2007, 110 in 2004, 112 in 2018, and 116 in 2013. The 2013 results tied for the 4th-best OPS+ of any championship team between 1971 and 2021.
Boston’s ERA+ 109 in 2013, 116 in 2004, 118 in 2018 and 123 in 2007. The 2007 results also tied for the 4th-best ERA+ of any world champion in the research timeframe.
Alternatives to OPS+ and ERA+
You’re not stuck with OPS+ and ERA+ if the limitations of their underlying stats trouble you. For example, just as RSNStats prefers wOBA to OPS, you might prefer wRC+ to OPS+ for measuring offense and FIP- for measuring pitching.