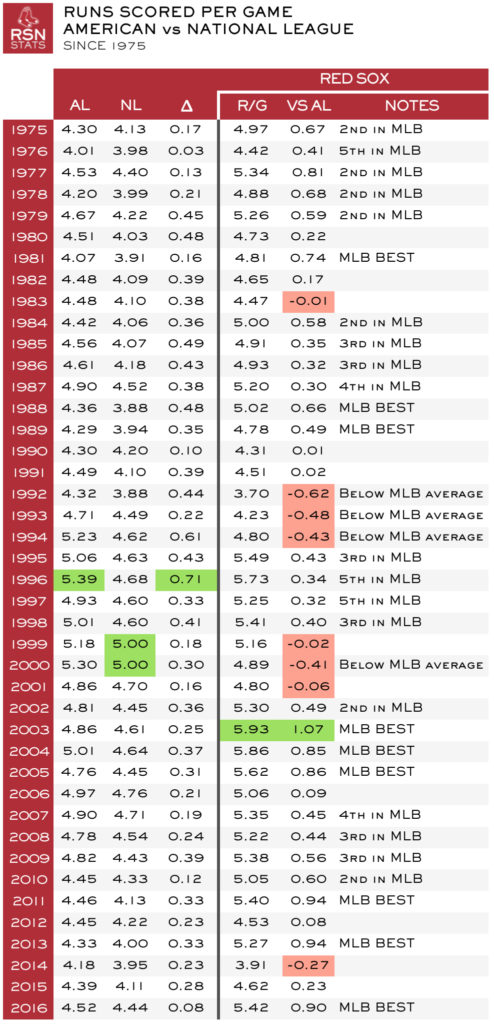
In 2016 the American League averaged just over four and a half runs per game, the league’s best such performance since averaging 4.82 runs per game in 2009. By comparison, the National League average last season was 4.44 runs/game, an uptick over their 2015 performance (4.11).2016 was the 42nd consecutive season that AL clubs averaged more runs per game than NL clubs. The senior circuit last edged the junior in 1974 when NL clubs averaged 4.15 runs/game vs the AL’s 4.10 total. In all the seasons that have come since, the greatest disparity was in 1996, with 5.39 runs/game for AL clubs vs 4.68 for the NL crews, a difference of 0.71.
The table to the right, admittedly a lot of data, shows the story, year by year. For each season starting from 1975 you can read, from left to right, the average runs scored by AL teams, by NL teams, and difference between the two. To the right of that are three columns that show Red Sox performance, including the club’s average runs/game, how that compared to the AL average, and notes about the Sox performance relative to the rest of Major League Baseball. Green shading spotlights peaks. Red shading draws your attention to those seasons when Sox performance fell below the AL average.
All things considered and as far as run scoring goes, the American and National Leagues were fairly evenly matched last season, the edge going to the AL by just 0.08 runs/game. That’s the smallest disparity since 1976 (0.03).

Red Sox: A Run Scoring Machine
Red Sox fans of recent vintage will likely not remember the teams of the 1990s that struggled with run production. In the nine seasons between 1992 and 2000, Boston scoring landed below baseball’s average four times (1992-94, 2000). The tide was turned, however, with the arrival of Manny Ramirez in 2001 and David Ortiz in 2003, with Boston turning in best-in-baseball performances for three straight years (2003-05), to say nothing of a World Championship.
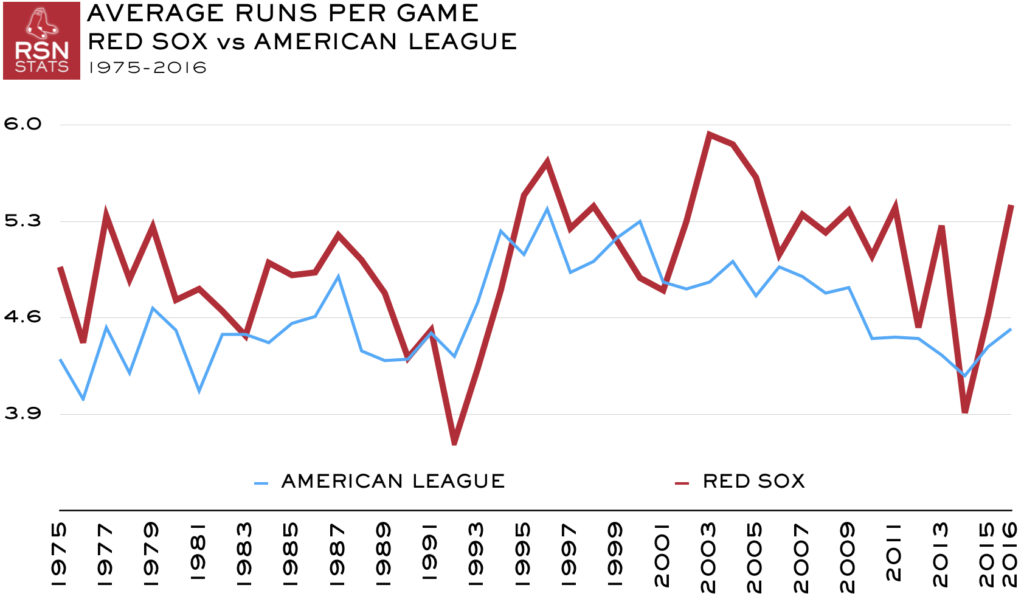
Despite the briefest appearance in the postseason in 2016 (which speaks volumes about the relative value of offensive prowess unsupported by reliable pitching), the Sox were again a well-oiled run scoring machine. Boston averaged a Major League best 5.42 runs/game, nearly a full run better than the league average (+0.90). Since 1975, the only better performing Sox clubs relative to AL run production average are the 2013 (+0.94), 2011 (+0.94), and 2003 (+1.07) editions.
Indeed, over the past 15 seasons the Red Sox have fallen below league run production averages just once (2014), but landed in MLB’s Top 3 in ten of those campaigns, including six times as the top run producers per game.
Tellingly, Boston averaged at least 0.45 runs more per game than the league in each of its World Championship seasons, though it’s also clear that owning MLB’s most productive offense is nothing close to a guarantee of postseason domination. Over the past 15 seasons, the team with baseball’s best runs/game ratio has won the Fall Classic just three times: the 2004 and 2013 Red Sox and the 2009 Yankees.
The chart below illustrates Red Sox average runs per game as compared to the league averages since 1975.